
The U.S. Fish and Wildlife Service (FWS, www.fws.gov) conducts the National Survey of Fishing, Hunting, and Wildlife Related Recreation every five years, most recently in 2012. According to the survey, 33.1 million people ages 16 years and older fish. Of those who fish, 21% travel to other states to do so.
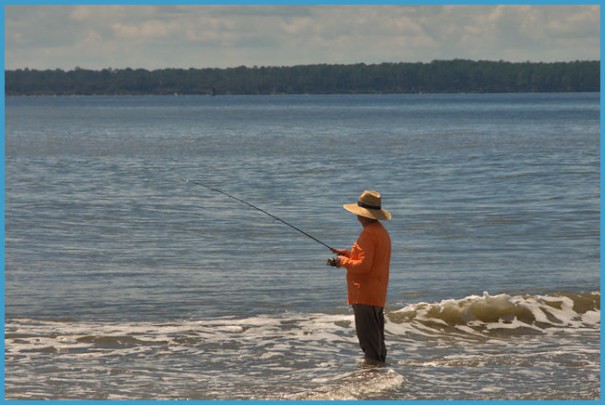
According to the FWS survey, 33.3 million anglers spend an average of 17 days fishing each year. Freshwater fishing is the most popular type of fishing, with over 27.5 million anglers devoted to the sport. Great Lakes and saltwater fishing are also popular, with 1.6 million and 8.9 million anglers, respectively. Annual spending for these activities is as follows:
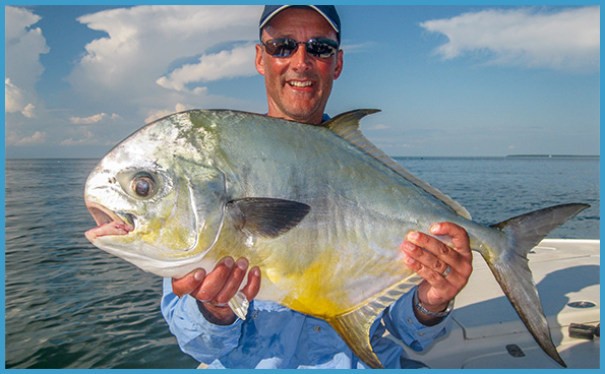
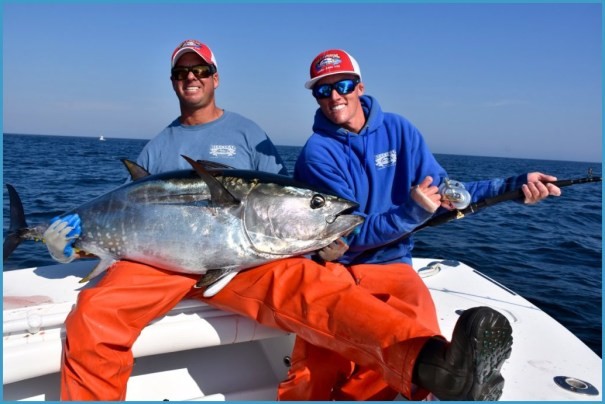
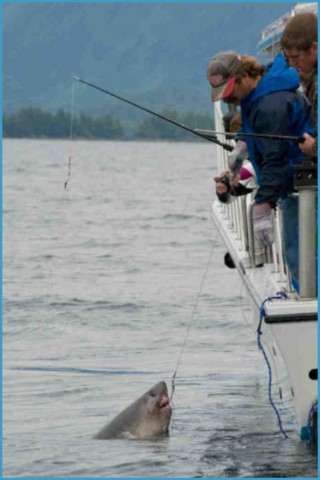
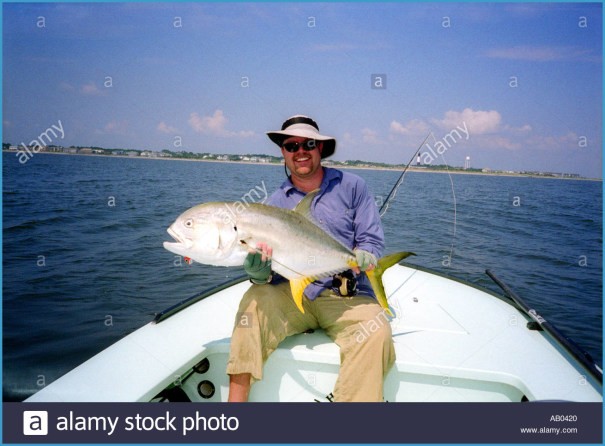
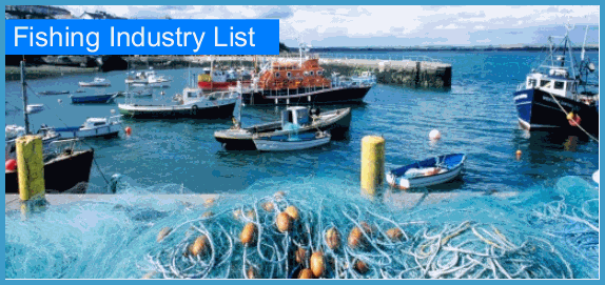
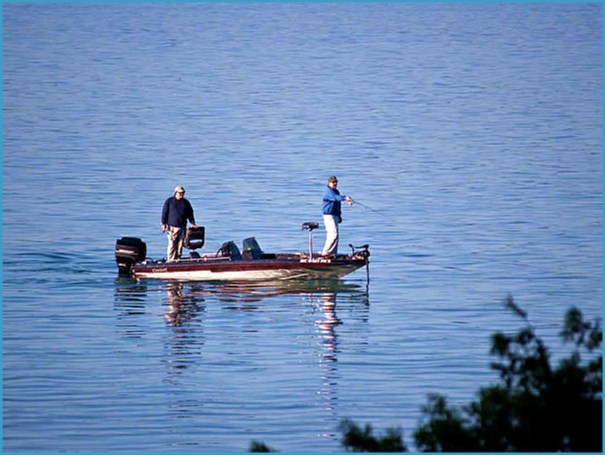
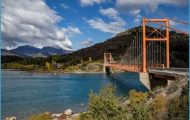
FISHING in USA Photo Gallery


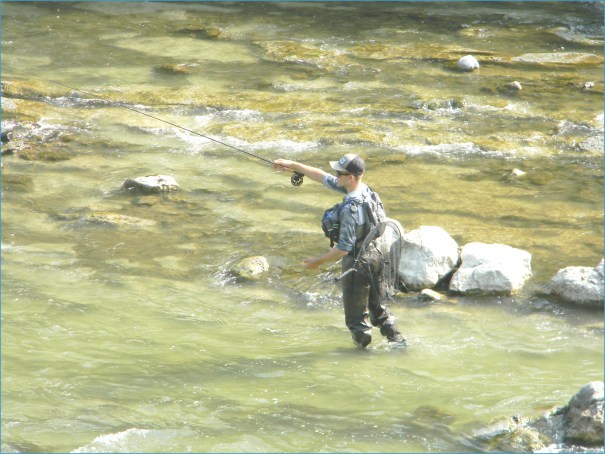
• Freshwater fishing: $23.8 billion
• Saltwater fishing: $10.3 billion
Anglers spent more than $41.8 billion each year.
Fishing Trips
Anglers take 455 million fishing trips each year. The average trip expenditure per angler is $1,262.
Trip-related spending on food, lodging, transportation, and other trip costs totals $21.8 billion. Distribution of all trip-related expenditures is as follows:
Food: $7.7 billion
Private transportation: $5.5 billion
Boating costs*: $3.8 billion
Lodging: $2.3 billion
Public transportation: $0.8 billion
Other trip costs: $7.0 billion
• includes launching, mooring, storage, maintenance, insurance, and fuel, but not cost of the boat
Of the total number of anglers, 30.0 million anglers fish within their home state and 7.0 million fish out of state.
Away-from-home participation rates by region is as follows:
• West North Central: 23%
• East South Central: 17%
• East North Central: 16%
West South Central: 16%
Mountain: 15%
South Atlantic: 13%
New England: 12%
Middle Atlantic: 11%
Pacific: 9%
Comparing results from the 2007 FWS survey with those of the 2012 survey reveals the number of anglers increased by 3% over the period. Fishing-related expenditures dropped 5% during the period.


